top of page

Observing Oil
Surface Area Due to
Seepage in Lake Maracaibo
- Josh Bridges, Ronnie Featherston, Jarret Garber,
Maria Squier, Whitney Warneke, Shan Zhao -


Results
 June 24, 2010 |  July 19, 2010 |  August 21, 2010 |
|---|---|---|
 September 3, 2010 |
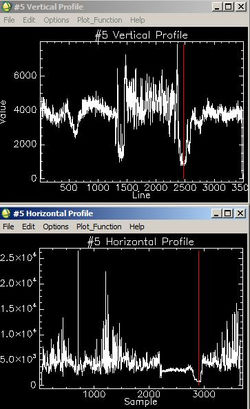
The vertical and horizontal profiles shown below give measures of the different elevations within the selected area. In the June and August profiles, a noticeable dip occurs in the two profiles, especially the horizontal profile. This indicates the presence of oil. This is due to the low reflectace of oil recorded as the oil surpresses the water surface. Note the value roughly falls around 1000 in the horizontal profile. In the July and September profiles, that same dip is not evident. This is due to the fact that so much oil covers the area that there is no discernible elevation changes. Note the value is roughly constant and also falls around 1000, in the horizontal profile just like the June and August profiles.
bottom of page